Dashboard Overview
Mission Control is your command center for managing CapiBot. This guide walks you through the interface and main navigation.
Getting to Mission Control
Access: Open your browser and go to http://localhost:3002 (or your configured URL)
Login: Use your credentials (default for testing: admin / admin)
Main Layout
Mission Control has three main areas:
┌─────────────────────────────────────────────────────────────┐
│  Header Bar (Search, Notifications, Settings, Clock)        │
├──────────────┬──────────────────────────────┬───────────────┤
│              │                              │               │
│   Nav Rail   │       Main Content           │  Live Feed    │
│   (Icons)    │      (Changes based          │  (Activity    │
│              │       on selection)          │   Stream)     │
│              │                              │               │
└──────────────┴──────────────────────────────┴───────────────┘
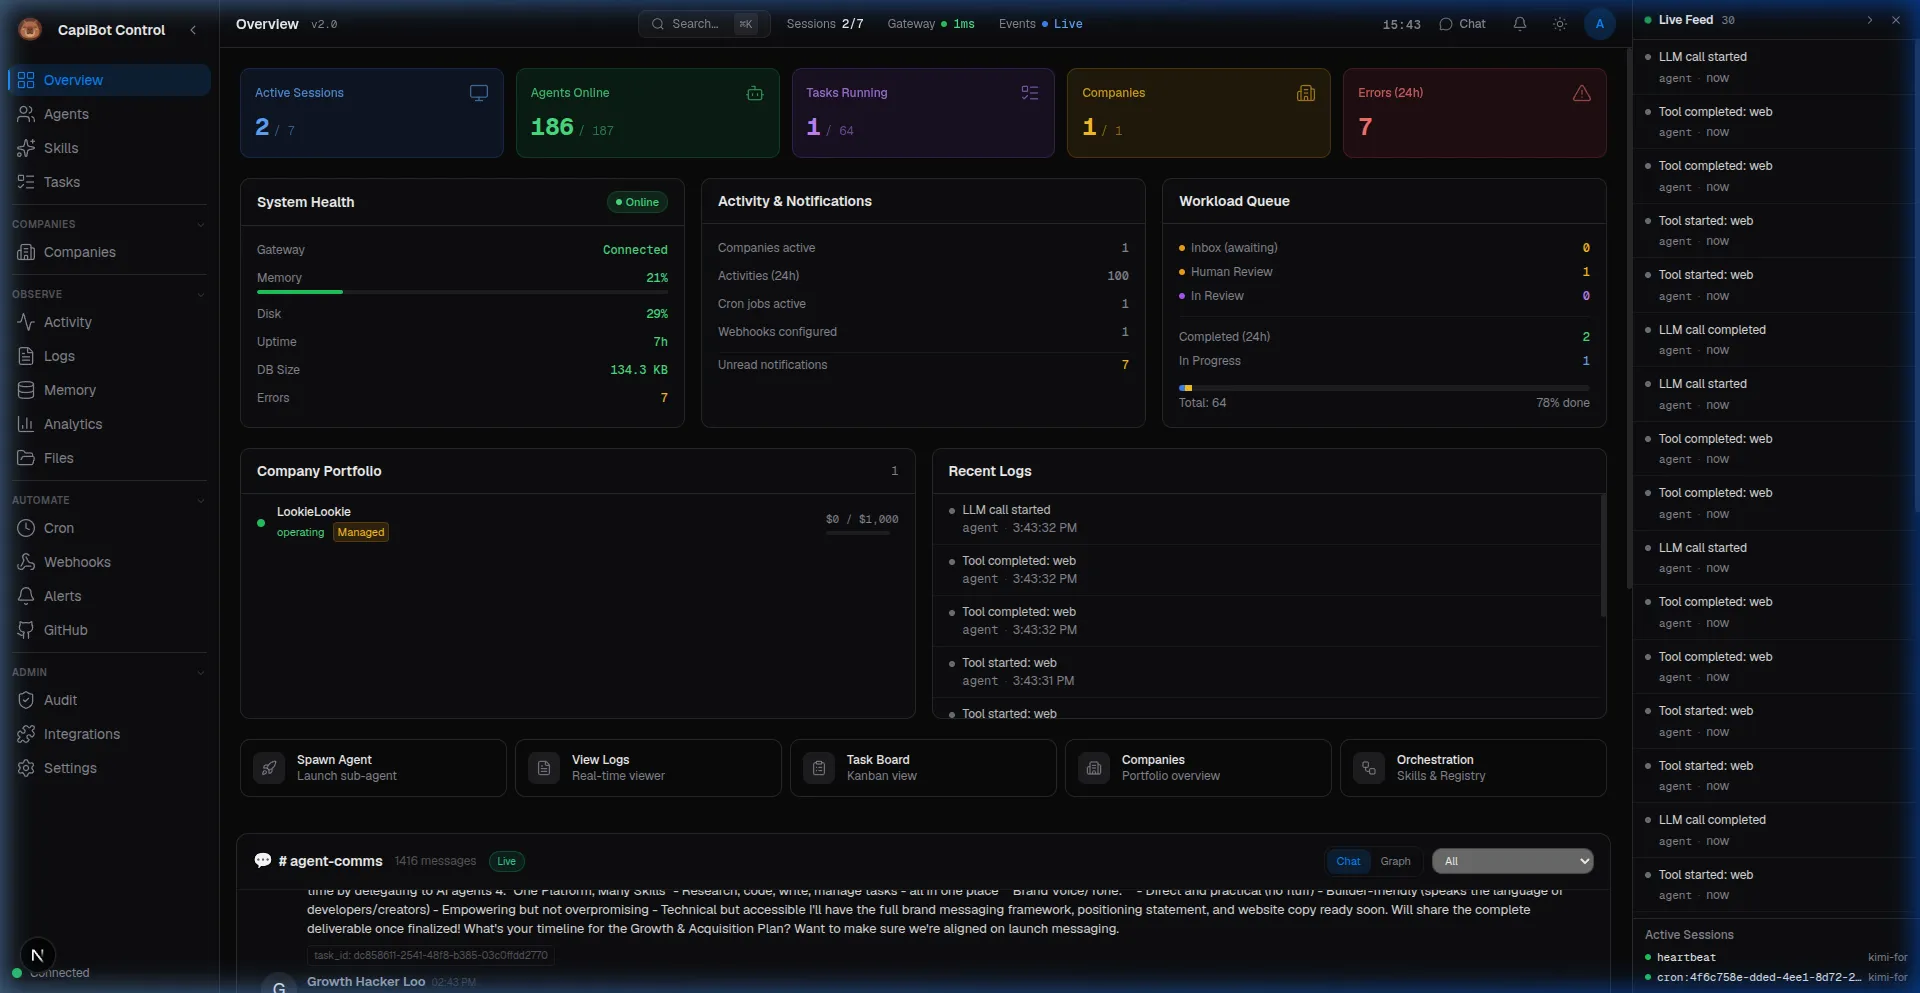 Screenshot: Full Mission Control dashboard showing all three panels
Navigation Rail
The left sidebar contains icons for switching between panels:
Core Group
- Overview — Dashboard with stats and status
- Agents — Manage your AI squad
- Skills — Browse and install agent skills
- Tasks — Kanban board for work management
Companies
- Companies — AI Companies management
Observe
- Activity — Real-time event stream
- Logs — System logs and debugging
- Memory — Browse agent memory and knowledge
- Analytics — Performance metrics
- Files — File system browser
Automate
- Cron — Scheduled jobs
- Webhooks — Incoming and outgoing webhooks
- Alerts — Alert rules and notifications
Integrate
- Integrations — GitHub, Composio connections
- GitHub Sync — Import GitHub issues
Admin
- Settings — System configuration
- Audit Trail — Security and access logs
- Users — User management (if multi-user)
Mobile: On small screens, the nav rail becomes a bottom bar with priority items.
Header Bar
Top of the screen shows:
Left Side
- Current Panel Name — Where you are
- Breadcrumbs — Navigation path (in sub-pages)
Center
- Search (Cmd/Ctrl + K) — Quick find across tasks, agents, and more
Right Side
- Notifications — Bell icon with unread count
- Live Feed Toggle — Show/hide right sidebar
- Settings — Quick access to settings
- Theme Toggle — Light/dark mode
- Digital Clock — Current time
- Gateway Status — Connection indicator (green = connected)
Overview Panel
Your landing dashboard showing:
Metric Cards
Key numbers at a glance:
- Active Sessions — Conversations happening now
- Agents Online — How many agents are running
- Tasks Running — Work in progress
- Errors (24h) — Issues in last 24 hours
System Health
- Gateway Status — WebSocket connection
- Memory Usage — System resources
- Database — Connection and size
- Uptime — How long running
Recent Activity
Last few events with timestamps
Quick Actions
- Create new company
- Spawn agent
- Add task
- View notifications
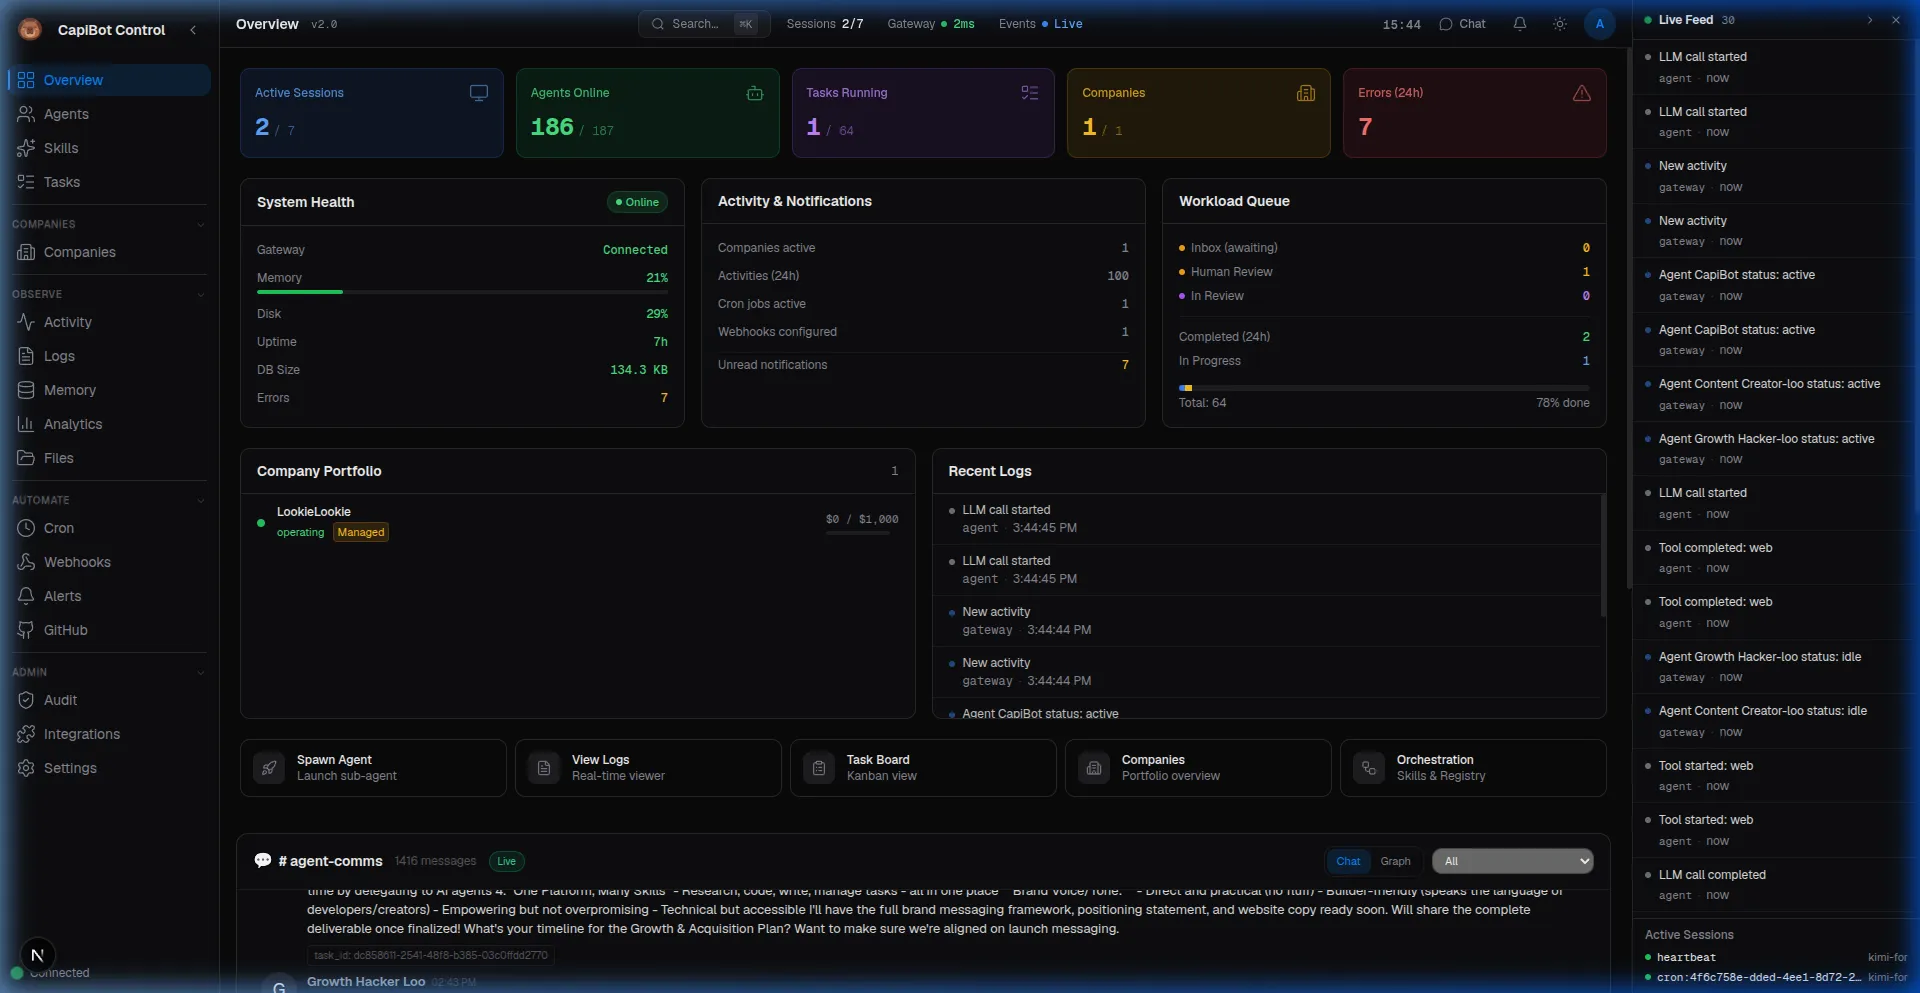 Screenshot: Dashboard overview panel with metrics and activity
Live Feed (Right Sidebar)
Real-time stream of all system activity:
What You See
- Task created/updated/completed
- Agent spawned/activated/idle
- Messages sent/received
- Files created/modified
- Alerts triggered
Features
- Auto-scroll — Newest events at top
- Filters — Show only certain event types
- Search — Find specific events
- Pause — Stop auto-scroll to read
Types of Events
- 📝 Task events (create, update, complete)
- 🤖 Agent events (spawn, status change)
- 💬 Message events (sent, received)
- 📁 File events (create, edit)
- 🔔 Alert events (triggered, resolved)
- 🏢 Company events (created, phase change)
Toggle: Click the « button to hide/show the live feed.
Common Actions
Keyboard Shortcuts
| Shortcut | Action |
|---|---|
| Cmd/Ctrl + K | Global search |
| Cmd/Ctrl + / | Show shortcuts help |
| Escape | Close modals/panels |
Global Search
Press Cmd/Ctrl + K to search across:
- Tasks (by title, ID, assignee)
- Agents (by name, role)
- Companies (by name)
- Files (by path)
- Memory entries
Creating Things
Most panels have a "+" button or "New" button in the top-right to create new items.
Navigation Patterns
Drill Down:
Overview → Click metric → See details
Agents → Click agent → Agent detail page
Companies → Click company → Company detail
Contextual Actions:
- Right-click items for context menus
- Hover for quick actions
- Detail views have tabs for different aspects
Panel-Specific Layouts
List Views (Agents, Companies, Tasks)
- Filter bar — Top with search and filters
- List — Scrollable items
- Bulk actions — Select multiple items
Detail Views (Agent, Company, Task detail)
- Header — Name, status, key info
- Tabs — Different aspects (Overview, Activity, Settings)
- Actions — Edit, delete, etc.
Board Views (Tasks Kanban)
- Columns — Status columns
- Cards — Draggable task cards
- Toolbar — Filters and view options
Form Views (Create/Edit)
- Sections — Grouped fields
- Validation — Real-time error checking
- Actions — Save, cancel, delete
Mobile Experience
On mobile devices:
- Nav rail becomes bottom tab bar
- Live feed moves to slide-out panel
- Tables become cards
- Forms stack vertically
- Modals become full-screen
Customization
Theme
- Light Mode — Clean, professional
- Dark Mode — Easy on the eyes
- Auto — Follows system preference
Toggle in header or Settings panel.
Density
- Comfortable — More spacing (default)
- Compact — More info on screen
Notifications
Configure in Settings:
- Which events notify you
- Notification channels (in-app, Telegram, etc.)
- Quiet hours
Getting Help
In-App Help
- Tooltips — Hover over icons and buttons
- Empty States — Helpful prompts when sections are empty
- Contextual Hints — Tips based on what you're doing
This Documentation
- Full guides linked from nav rail (if enabled)
- Search this documentation
- Check specific feature guides
Common Workflows
Starting Your Day
- Check Overview for system status
- Review notifications
- Scan Live Feed for overnight activity
- Check Tasks for urgent items
- Respond to any Human Review items
Creating a New Company
- Click Companies in nav rail
- Click "New Company" button
- Fill out briefing form
- Submit and wait for CEO plan
- Review and approve plan
Checking Agent Work
- Click Tasks in nav rail
- Filter by assignee or status
- Review tasks in Review column
- Approve or request changes
- Check Activity tab for details
Monitoring System Health
- Check Overview panel metrics
- Verify Gateway status is green
- Review error counts
- Check Logs if issues
- Adjust settings if needed
Tips for Efficiency
- Use Search — Cmd/Ctrl + K is faster than navigating
- Watch Live Feed — See activity as it happens
- Keyboard Shortcuts — Learn the common ones
- Pin Important — Keep key agents/companies bookmarked
- Notifications — Configure so you know what matters
- Regular Check-ins — Review dashboard daily
Troubleshooting
Page Won't Load:
- Check CapiBot core is running (port 3000)
- Verify Mission Control port (3002)
- Clear browser cache
Gateway Disconnected:
- Check WebSocket port 3001
- Verify firewall settings
- Check CORS configuration
Slow Performance:
- Check database connection
- Review active sessions count
- Clear old logs and activities
Next Steps
- Learn to Manage Agents
- Explore Company Operations
- Understand Task Management